
DevOps CI/CD metrics fall into three categories: automation performance, speed, and quality. Monitoring these metrics allows organizations to measure pipeline maturity, identify bottlenecks, and deliver high-quality software releases consistently and faster than their competition. This article covers the key DevOps CI/CD metrics in each category and how to use them to optimize pipeline performance.
(This article is part of our DevOps Guide. Use the right-hand menu to go deeper into individual practices and concepts.)
What is CI/CD and why does it matter for DevOps?
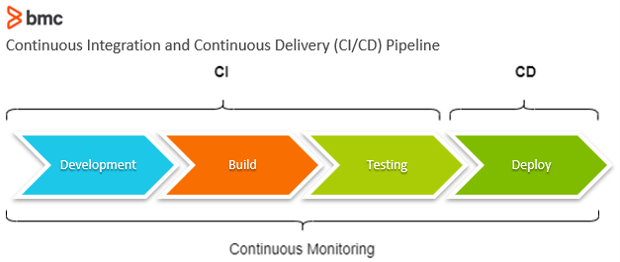
CI/CD combines Continuous Integration and Continuous Delivery into an automated end-to-end software development and release pipeline—enabling teams to ship code faster, catch defects earlier, and maintain consistent release quality.
Continuous Integration (CI) refers to the process of merging software builds on a continuous basis. Development teams divide large-scale projects into small coding tasks and deliver code updates iteratively. Builds are pushed to a centralized repository where further automation, QA, and analysis take place.
Continuous Delivery (CD) takes continuously integrated software builds and extends the process with automated release. All approved code changes and software builds are automatically released to production, where test results are further evaluated and the software becomes available for deployment.
Deployment often requires DevOps teams to follow a manual governance process. However, an automation solution may also be used to continuously approve software builds at the end of the software development (SDLC) pipeline, making it a Continuous Deployment process.
(Read more about CI/CD or set up your own CI/CD pipeline.)
What metrics measure CI/CD pipeline quality?
Pipeline quality metrics measure how effectively teams produce release-ready code by tracking defect rates and test performance before builds reach production.
DevOps organizations should introduce test procedures early during the SDLC lifecycle—a practice known as shifting left—so developers can address quality issues well before a build reaches production environments. The following metrics measure CI/CD pipeline quality:
Test pass rate
The ratio of passed test cases to total test cases. A declining test pass rate is an early signal of code quality issues that will compound downstream.
Number of bugs
The number of issues that cause performance problems at a later stage. Tracking bug volume over time reveals whether quality practices are improving or degrading across releases.
Defect escape rate
The number of defects identified in production compared to defects caught in pre-production. A high defect escape rate indicates insufficient pre-production test coverage and signals that shift-left practices are not yet fully effective.
Number of code branches
The count of feature components introduced into the development project. Monitoring branch volume helps teams manage integration complexity and reduce the risk of merge conflicts.
How do you measure CI/CD automation performance?
CI/CD automation performance is measured through deployment frequency, deployment size, and deployment success rate—the three metrics that reveal whether automation is accelerating delivery or introducing new operational risk.
Automation is the heart of DevOps and a critical component of a healthy CI/CD pipeline. DevOps thrives on automation adopted strategically—replacing repetitive, predictable tasks with automated solutions and scripts. Given the scale of tasks in a modern CI/CD pipeline, maximizing automation coverage while closely monitoring its performance is essential.
Deployment frequency
How often the organization successfully deploys to production. Deployment frequency measures the throughput of the DevOps pipeline and reflects how effectively automation has streamlined QA and CI/CD processes.
Deployment size
The volume of code delivered per deployment. Tracking deployment size over time helps teams assess whether automation is genuinely expanding delivery capacity.
Deployment success rate
Whether frequent deployments introduce downtime, outages, or performance and security issues. High deployment frequency is only valuable when deployments consistently succeed without disrupting production.
How do you evaluate DevOps infrastructure dependability?
Infrastructure dependability is measured using MTTF, MTTR, MTTD, time to value, and infrastructure utilization—the metrics that confirm whether the underlying infrastructure can sustain high-frequency CI/CD delivery without degradation.
A CI/CD pipeline responsible for hundreds—or thousands—of delivery cycles daily depends on consistent, reliable infrastructure. Instability at the infrastructure layer propagates directly into delivery failures, making dependability metrics as critical as the pipeline-level metrics above.
MTTF, MTTR, and MTTD
These metrics quantify the risk associated with infrastructure failures and the time required to recover to optimal performance. Learn more about reliability calculations and metrics for infrastructure or service performance.
Time to value
The time elapsed before a completed software build is released into production. Delays may stem from infrastructure resource constraints, automation gaps, or the manual governance process required for final release. Reducing time to value is a direct indicator of CI/CD pipeline maturity.
Infrastructure utilization
The performance of every service node, server, hardware component, and virtualized IT resource in the pipeline. Infrastructure utilization data describes the computational capacity available to CI/CD teams and generates the telemetry needed to surface security and performance issues across the network infrastructure.
With these DevOps CI/CD metrics reliably in place, organizations have a clear, data-driven picture of how close to optimal their pipeline really is.
Frequently asked questions
What are the three categories of DevOps CI/CD metrics?
DevOps CI/CD metrics fall into three categories: quality metrics (test pass rate, defect escape rate, number of bugs, number of code branches), automation performance metrics (deployment frequency, deployment size, deployment success rate), and infrastructure dependability metrics (MTTF, MTTR, MTTD, time to value, infrastructure utilization). Together these categories provide a complete view of CI/CD pipeline health.
What is defect escape rate and why does it matter?
Defect escape rate is the proportion of defects that pass through pre-production testing and are discovered only in production. A high defect escape rate signals that pre-production test coverage is insufficient and that shift-left testing has not been fully adopted. Reducing defect escape rate is one of the clearest indicators of improving CI/CD pipeline quality.
What is deployment frequency in DevOps?
Deployment frequency measures how often a DevOps team successfully deploys code to production. It is a key indicator of CI/CD pipeline throughput and reflects the maturity of the team’s automation capabilities. High deployment frequency combined with a consistently high deployment success rate is characteristic of a high-performing DevOps organization.
What does MTTR mean in a CI/CD context?
MTTR (Mean Time to Repair) is the average time required to restore normal service after an infrastructure failure. In a CI/CD context, a high MTTR means pipeline disruptions take too long to resolve—directly reducing deployment frequency and extending time to value. Lowering MTTR is a core goal of infrastructure reliability practice in DevOps.
How does shifting left improve DevOps CI/CD metrics?
Shifting left means introducing testing and quality checks earlier in the SDLC—during development rather than at the end of the pipeline. When teams shift left, defects are caught before they compound: test pass rates improve, defect escape rates drop, and overall pipeline quality metrics trend upward over successive release cycles.
Related reading
- BMC DevOps Blog
- Deployment Pipelines (CI/CD) in Software Engineering
- Continuous Delivery Metrics
- DevOps Team Structure
The views and opinions expressed in this post are those of the author and do not necessarily reflect the official position of BMC.
These postings are my own and do not necessarily represent BMC's position, strategies, or opinion.
See an error or have a suggestion? Please let us know by emailing [email protected].